I'm currently going through the Data Science Specialization on Coursera. You can track my work through the classes here and learn more about the Data Science Specialization here: John Hopkin's University 'Data Science Specialization' track.
I'm taking the courses in order to backfill my understanding of the hows, whys and pitfalls in data analysis. The courses also happen to be in R, which is a language I have literally never used in my day job.

The Problem
I am using R in a course, but I realize that I have huge gaps in understanding the language's fundamentals.
The Solution
I decided to try out the Try R course on Code School.
What's Super Cool...
The Try R course on Code School is totally free!
The syllabus:
- R Syntax: A gentle introduction to R expressions, variables, and functions
- Vectors: Grouping values into vectors, then doing arithmetic and graphs with them
- Matrices: Creating and graphing two-dimensional data sets
- Summary Statistics: Calculating and plotting some basic statistics: mean, median, and standard deviation
- Factors: Creating and plotting categorized data
- Data Frames: Organizing values into data frames, loading frames from files and merging them
- Working With Real-World Data: Testing for correlation between data sets, linear models and installing additional packages
1. R Syntax Module
Thoughts:

Alright... so they're starting off slow... reeeeal slow
What I Learned:
Wrapping a function in help() gives you the function's documentation - and wrapping it in example() gives you an example.
2. Vectors
Thoughts:

I like that Code School courses take time to point out things like: "Many languages start array indices at 0, but R's vector indices start at 1." I feel like Code School does a good job of preparing their courses to span different backgrounds of student.
Also - this course is jumping pretty quickly into useful stuff - in fact it's already teaching plotting!
What I Learned:
Vectors automatically enumerate on mathematical functions. For example:
a <- c(1, 2, 3)
a + 1
2, 3, 4
3. Matrices
Thoughts:

I am not an adult.
What I Learned:
Create a contour map of the values simply by passing the matrix to the contour function.
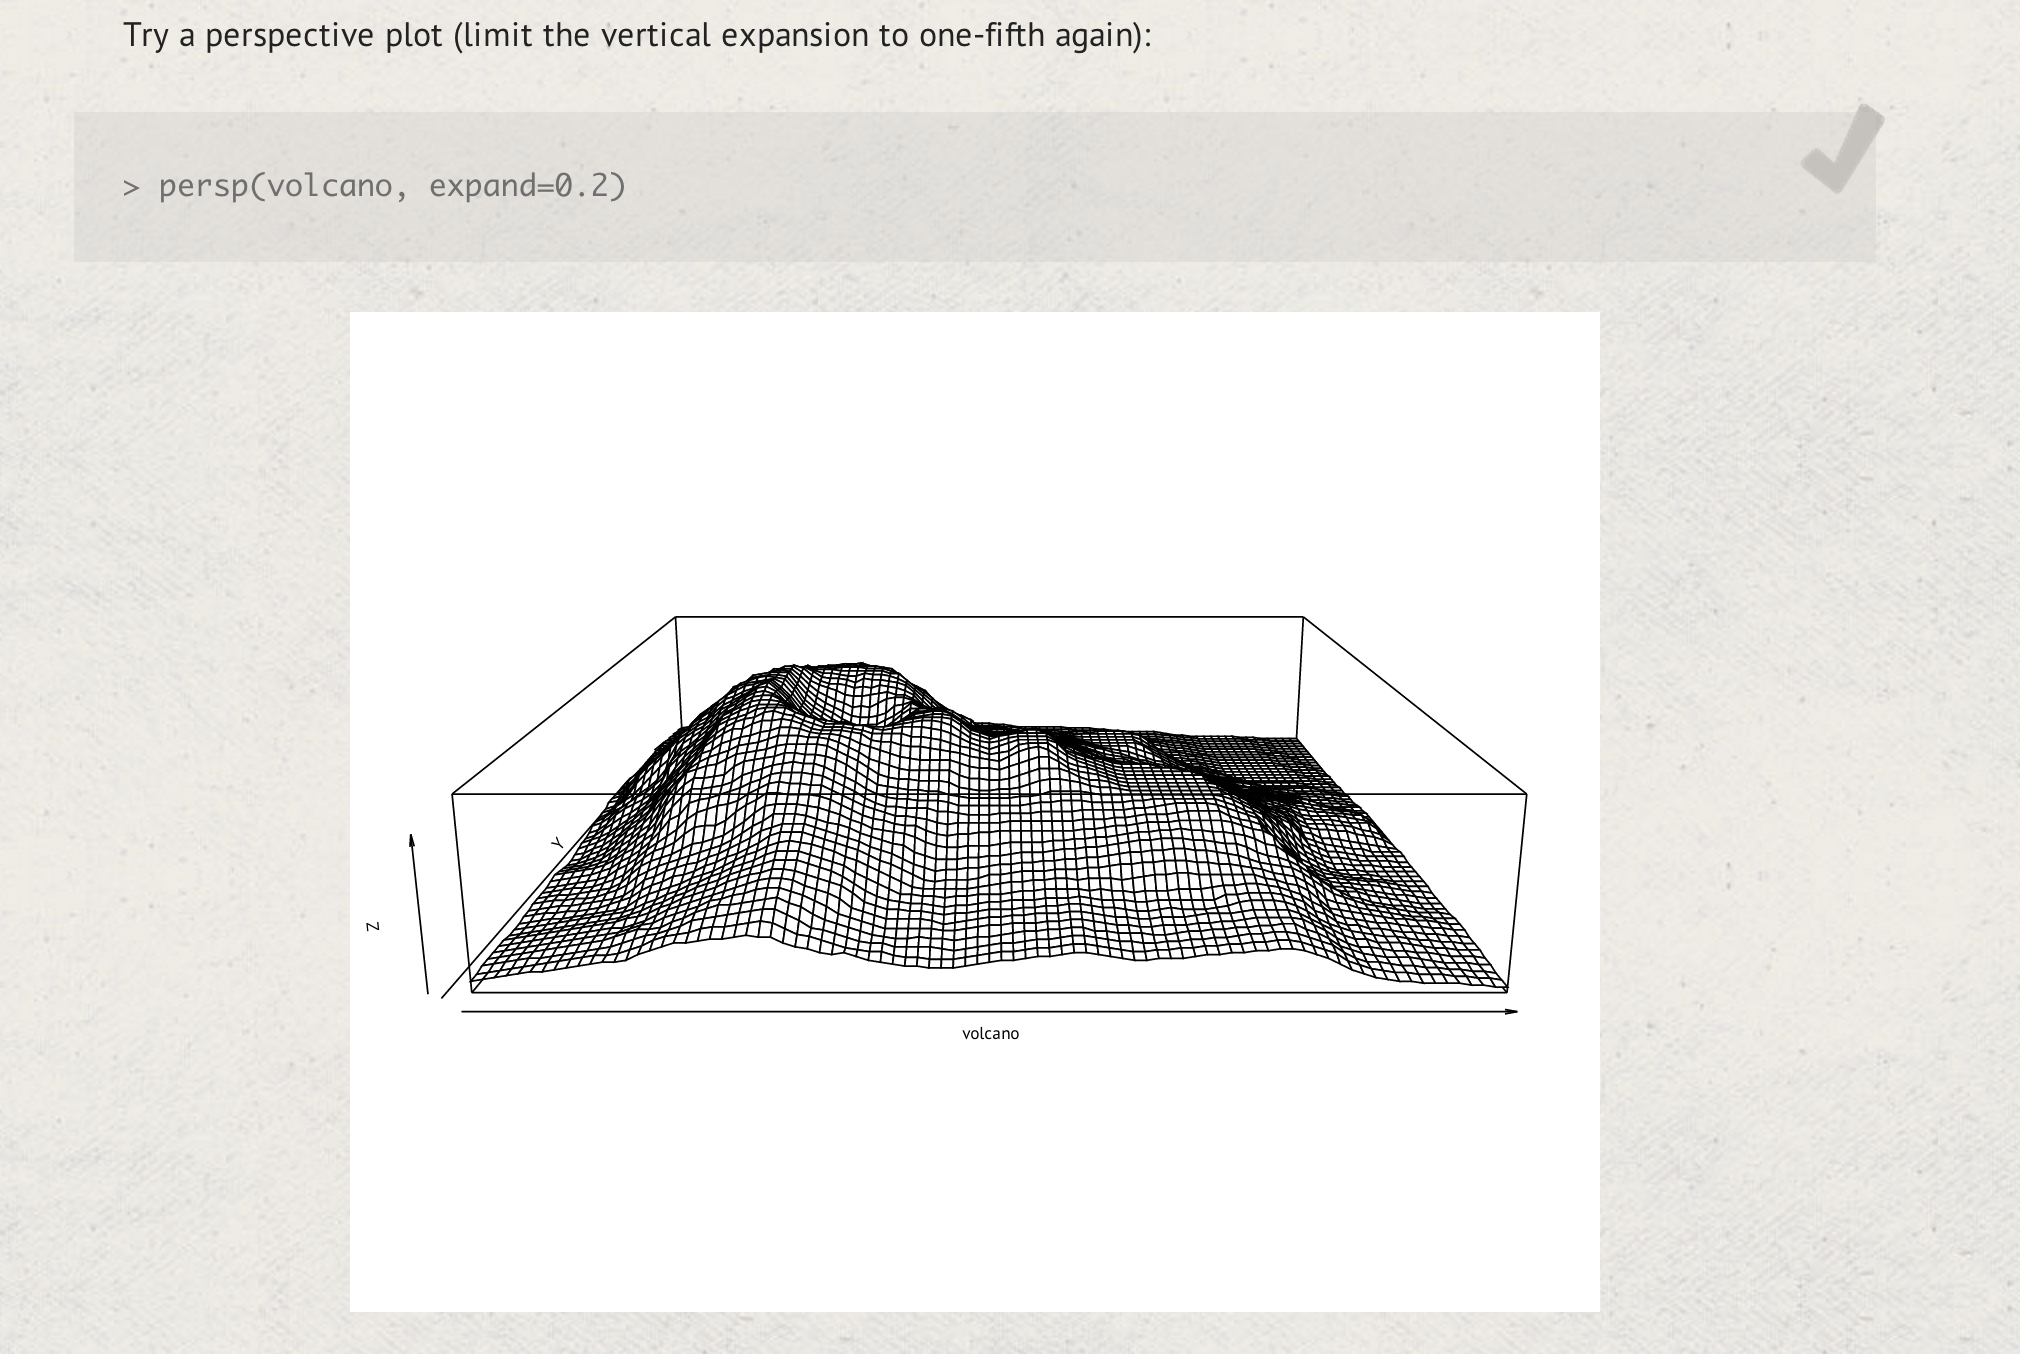
Create a 3d map with persp(). They show an amazing example with Volcano data (which comes as sample data with R).
4. Summary Statistics
Thoughts:
This was a fast little section on plotting - covering mean, standard deviation, median and how to plot with lines to indicate said values. Nothing too shocking or interesting here, but likely because I've been taking classes on this exact thing.
5. Factors
Thoughts:
Factors are pretty damn cool. Had to read through the tutorial a few times just to figure out the final chunk though. I think it's pretty easy with Code School to just 'copy-pasta' the command and not think about what it actually means. Case in point:

Wait. What?
6. Data Frames
Thoughts:
This section when through the difference between read.csv and read.table - which was helpful. But it really didn't go very far into depth on what data frames can do... or how to handle complicated merging... etc. Didn't really feel like I deserved a badge at the end of this one (but I'm keeping it anyway).
What I Learned:
"You can get individual columns by providing their index number [or name] in double-brackets."
I get endlessly confused by the notation changes between vectors, data frames, data tables, etc.
6. Real World Data
Thoughts:
This section is a lot beefier and 'Real World Examples' tend to help me learn a little bit better.
That said - I'm pretty bummed that none of the examples here showed crappy data and how to handle that.
What I Learned:
You can get help for a package by calling the help function and passing the package name in the package argument.
R can test for correlation between two vectors with the cor.test function.
Conventionally, any correlation with a p-value less than 0.05 is considered statistically significant
Course Completed...
O'Reily gives you a pretty great 40-50% off discount after completing the R course on any of their R related books.
Overall the course was worth the ~2 hours I spent doing it/writing about it.
And hey.. check out my sweet badge:
